· engineering
Debug Broken Tunnels Fast With Tunnel Doctor
Debug localhost tunnel failures layer by layer with Tunnel Doctor across DNS, TLS, connector, access protection, and local app checks, and look up diagnostic codes in the docs.
By InstaWormhole team, Engineering
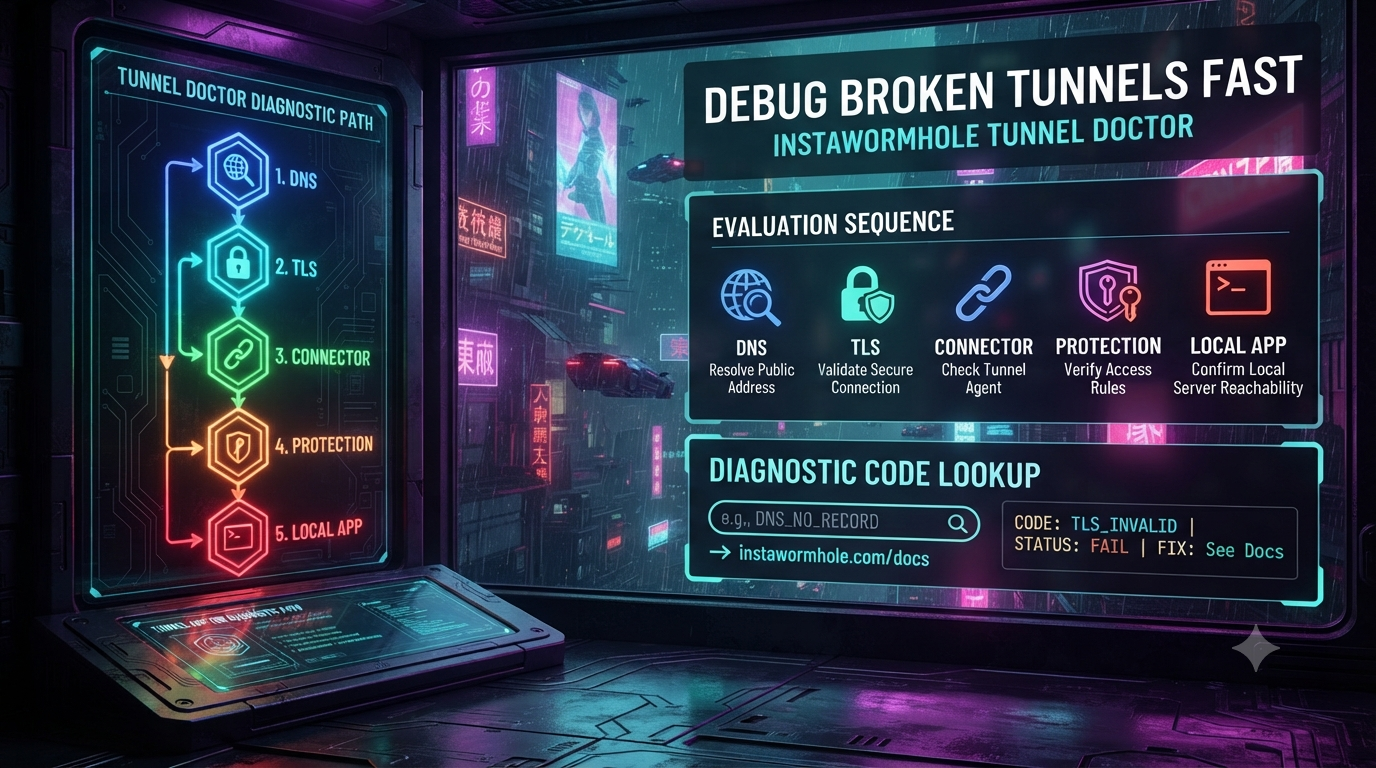
When a public tunnel address stops reaching your local app, the symptom rarely tells you where the problem is. A blank page, a 502, a timeout and a password prompt you did not expect can each come from a different part of the path between the internet and your machine. Guessing means restarting servers and retrying requests while a demo or webhook test waits.
InstaWormhole’s Tunnel Doctor replaces the guessing. According to the Tunnel Doctor guide, it finds which part of the path from the internet to your app is failing and tells you what to do about it. This article explains how it works, how to read its results, and how to use its diagnostic codes.
What Tunnel Doctor Does
Tunnel Doctor applies to durable tunnels on all plans, and the docs estimate a run at about 3 minutes. You start it from the dashboard: open the tunnel and choose Run Tunnel Doctor. The button changes to “Checking every layer” and then shows the result.
A few things are worth knowing before you run it:
- It sends one GET request to the tunnel’s public address.
- It sends no credentials and follows no redirects.
- It keeps only the status and the relay’s code. It changes nothing, and a report is not stored.
- The request is sent from the InstaWormhole edge, so the docs note that it is not an independent outside check.
- You can run it once every 10 seconds for a tunnel.
The Seven Layers, in Request Order
Tunnel Doctor checks the layers in the order a request travels:
- Address lookup (DNS)
- Secure connection (TLS)
- Tunnel state
- Connector
- Access protection
- Your app
- Request through the public address
The order matters because an earlier failure can explain later ones. The docs say to start with the first layer marked as failing and follow its instruction. Fixing that layer often clears the layers after it.
Fix the first failing layer, then run Tunnel Doctor again. The layer you fixed should show as passing.
Reading the Overall Result
Tunnel Doctor gives one of four overall results:
| Result | What it means |
|---|---|
| Working: a request through the public address reached your app | Every layer passed. |
| Working, with something to look at | The tunnel works and one layer has a warning. |
| Not working | A layer failed. Fix the first failing layer. |
| Checked up to the password prompt | The tunnel has a password, so the check stopped at the prompt. This is expected. |
The last result is not a failure. If your tunnel has a password, the checker cannot see past the prompt. Open the address yourself and sign in to confirm your app answers.
Diagnostic Codes Tell You Who Fixes It
Each finding has a stable diagnostic code. The diagnostic code reference groups every code by layer and says who fixes it. You means the fix is on your computer or in your dashboard. InstaWormhole means the problem is on InstaWormhole’s side and there is nothing to change on yours.
That distinction saves time. Some findings you can resolve immediately, and others only need a re-check:
| Layer | Example code | Who fixes it | What the docs say to do |
|---|---|---|---|
| Address lookup (DNS) | DNS_NO_RECORD | InstaWormhole | Nothing to change on your side. Run the check again in a few minutes, and contact support with the diagnostic ID if it continues. |
| Secure connection (TLS) | TLS_HANDSHAKE_FAILED | InstaWormhole | Run the check again in a minute, and contact support if it continues. |
| Tunnel state | ROUTE_PAUSED | You | Resume the tunnel, then start the connector again with the command under Connect an app. |
| Connector | CONNECTOR_OFFLINE | You | Start the connector on the computer running your app, and check its output for an error if it is already running. |
| Connector | CONNECTOR_UNAVAILABLE | You | The connector is recorded as connected but did not take the request. Restart it with Ctrl+C, then the command under Connect an app. |
| Access protection | ACCESS_UNAVAILABLE | InstaWormhole | The edge could not apply the tunnel’s access rule, so it refuses visitors. Run the check again in a minute. |
| Your app | ORIGIN_UNREACHABLE | You | Make sure your app is running and that the --origin address in the connector command matches the port it listens on. |
| Request through the public address | REQUEST_PROTECTED | Nothing to fix | The checker does not know the password, so open the address yourself and sign in. |
When you contact support, quote the code and the diagnostic ID.
Walking Through Common Failures
The Tunnel Was Paused or Stopped
If Tunnel Doctor reports ROUTE_PAUSED or ROUTE_STOPPED, the fix is on your side. Resume the tunnel in the dashboard, then start the connector again with the command shown under Connect an app. An expired tunnel (ROUTE_EXPIRED) is different, because the docs say it cannot be switched on again. You need to create a new tunnel and connect your app to it.
The Connector Is Offline or Not Taking Requests
CONNECTOR_OFFLINE means the connector is not running. Start it on the computer that runs your app. The docs show the durable tunnel form of the command like this, with the tunnel ID copied from the tunnel’s Connect an app section:
npx @instawormhole/connector run --relay wss://relay.instawormhole.site --origin 127.0.0.1:3000 --stored-device --tunnel <tunnel id>CONNECTOR_UNAVAILABLE is the case where the connector is recorded as connected but did not take the request, and the fix is to restart it. The docs also say that if the connection drops, for example when your computer sleeps, the connector reconnects on its own and a durable tunnel keeps its address. If it does not recover, restart it.
Your App Is Not Where the Connector Expects
ORIGIN_UNREACHABLE means the connector could not reach your app. Check that the app is running and that the port in --origin matches the port it listens on, for example 127.0.0.1:3000. The connector only accepts loopback addresses for --origin, and the docs say a local server that only accepts HTTPS is not supported.
Two related codes cover slow or crashing apps:
ORIGIN_SLOW: your app accepted the request but did not answer within 15 seconds. Check whether it is busy or stuck, and that the start page answers quickly.ORIGIN_NO_RESPONSE: your app closed the connection without sending a response. Check your app’s logs for a crash or an error onGET /.
Tunnel Doctor sends its check to your app with an X-Instawormhole-Diagnostic header, so your app’s logs show the request. This helps you confirm that the check actually arrived.
A Development Server Refuses the Tunnel’s Address
If a page loads unstyled or says “Blocked request”, your development server may be refusing the tunnel’s address. Tunnel Doctor recognises common cases and shows the exact line to add, with your address filled in. The docs list these codes:
REQUEST_VITE_HOST_BLOCKED: add the tunnel’s address toserver.allowedHostsinvite.config.js, then restart the dev server.REQUEST_VITE_PREVIEW_HOST_BLOCKED: add it topreview.allowedHosts, then restartvite preview.REQUEST_NEXT_DEV_ORIGIN_BLOCKED: add it toallowedDevOriginsinnext.config.js, then restartnext dev.REQUEST_VITE_HMR_UNREACHABLE: point Vite’s live reload at the tunnel on port 443 overwss, then restart the dev server. In Vite 8 the same keys sit underserver.ws.
The Tunnel Asks for a Password You Did Not Expect
If the address prompts for a password, the tunnel has a password or token set. Open the address in a private window and sign in, or send the token header. Tunnel Doctor reports this as “Checked up to the password prompt”, and the REQUEST_PROTECTED code means the same thing. The docs separately describe ACCESS_NOT_ENFORCED, where a request without the password reached your app. In that case they tell you to pause the tunnel immediately and contact support with the diagnostic ID.
Limits That Look Like Outages
Some failures come from plan limits rather than faults. The docs describe two:
ROUTE_TRANSFER_LIMIT: the workspace has used its plan’s monthly transfer allowance (5 GB on Free). Tunnels serve again on the 1st of next month (UTC).REQUEST_RATE_LIMITED: the tunnel is getting more requests a minute than its plan allows (120 on Free), so the relay turned the check away. Run the check again in a minute, and if real visitors see this too, reduce automated traffic to the address.
If the address answers 429, the troubleshooting guide says the same thing: wait a minute, or see the plan limits page.
Custom Domains
If you connect your own domain, Tunnel Doctor also reports custom domain codes. These use a status of pass, warning, unknown or fail:
DOMAIN_ACTIVE: the domain is active.DOMAIN_WAITING: nothing to do yet, so run the check again in a few minutes.DOMAIN_RECORDS_MISSING: create the missing record at your DNS provider, exactly as shown under Custom domain. The docs say DNS changes can take up to an hour to show.DOMAIN_FAILEDandDOMAIN_DETACHED_DNS: fix or restore the records at your DNS provider, then choose Check again under Custom domain.
When the Symptom Is All You Have
Sometimes you only see the browser symptom. The troubleshooting guide maps common symptoms to causes. It recommends running Tunnel Doctor first because it names the failing layer.
| What you see | What the docs say it means |
|---|---|
| 404 with no page | No connector is serving this address. Resume the tunnel if it is paused or stopped, and start the connector. |
| 502 or 503 | The connector is connected but could not reach your app. Make sure the app is running and that --origin matches its port. |
| Timeout | Your app is slow to answer. By default the connector waits up to 10 minutes for a response to start and 2 minutes with no data. You can raise the wait with --origin-timeout. |
| 429 | The tunnel hit its plan’s requests-per-minute limit or the workspace hit its monthly transfer. |
| 410, “disabled” | The tunnel’s address was disabled for violating the Acceptable Use Policy. Contact support with the tunnel address if you think this is a mistake. |
A Repeatable Workflow
- Open the tunnel in the dashboard and choose Run Tunnel Doctor.
- Read the overall result.
- Find the first layer marked as failing.
- Look up its diagnostic code in the diagnostic code reference to see who fixes it and what to try.
- Apply the fix.
- Run Tunnel Doctor again and confirm the layer now passes.
The docs define the finish line clearly. You are done when the overall result says Working, or when it names the first layer that failed and what to do.
Conclusion
A broken tunnel is much easier to fix once you know which layer failed. Tunnel Doctor checks the seven layers in request order, gives each finding a stable code, and tells you whether the fix is yours or InstaWormhole’s. Run it first, fix the first failing layer, and run it again. For anything it cannot resolve, contact support with the code and the diagnostic ID. The full details are in the InstaWormhole documentation.